Master Pivot Tables Like a Pro
Pivot tables are one of Excel's most powerful features, but most users only scratch the surface. Here are advanced techniques to supercharge your data analysis.
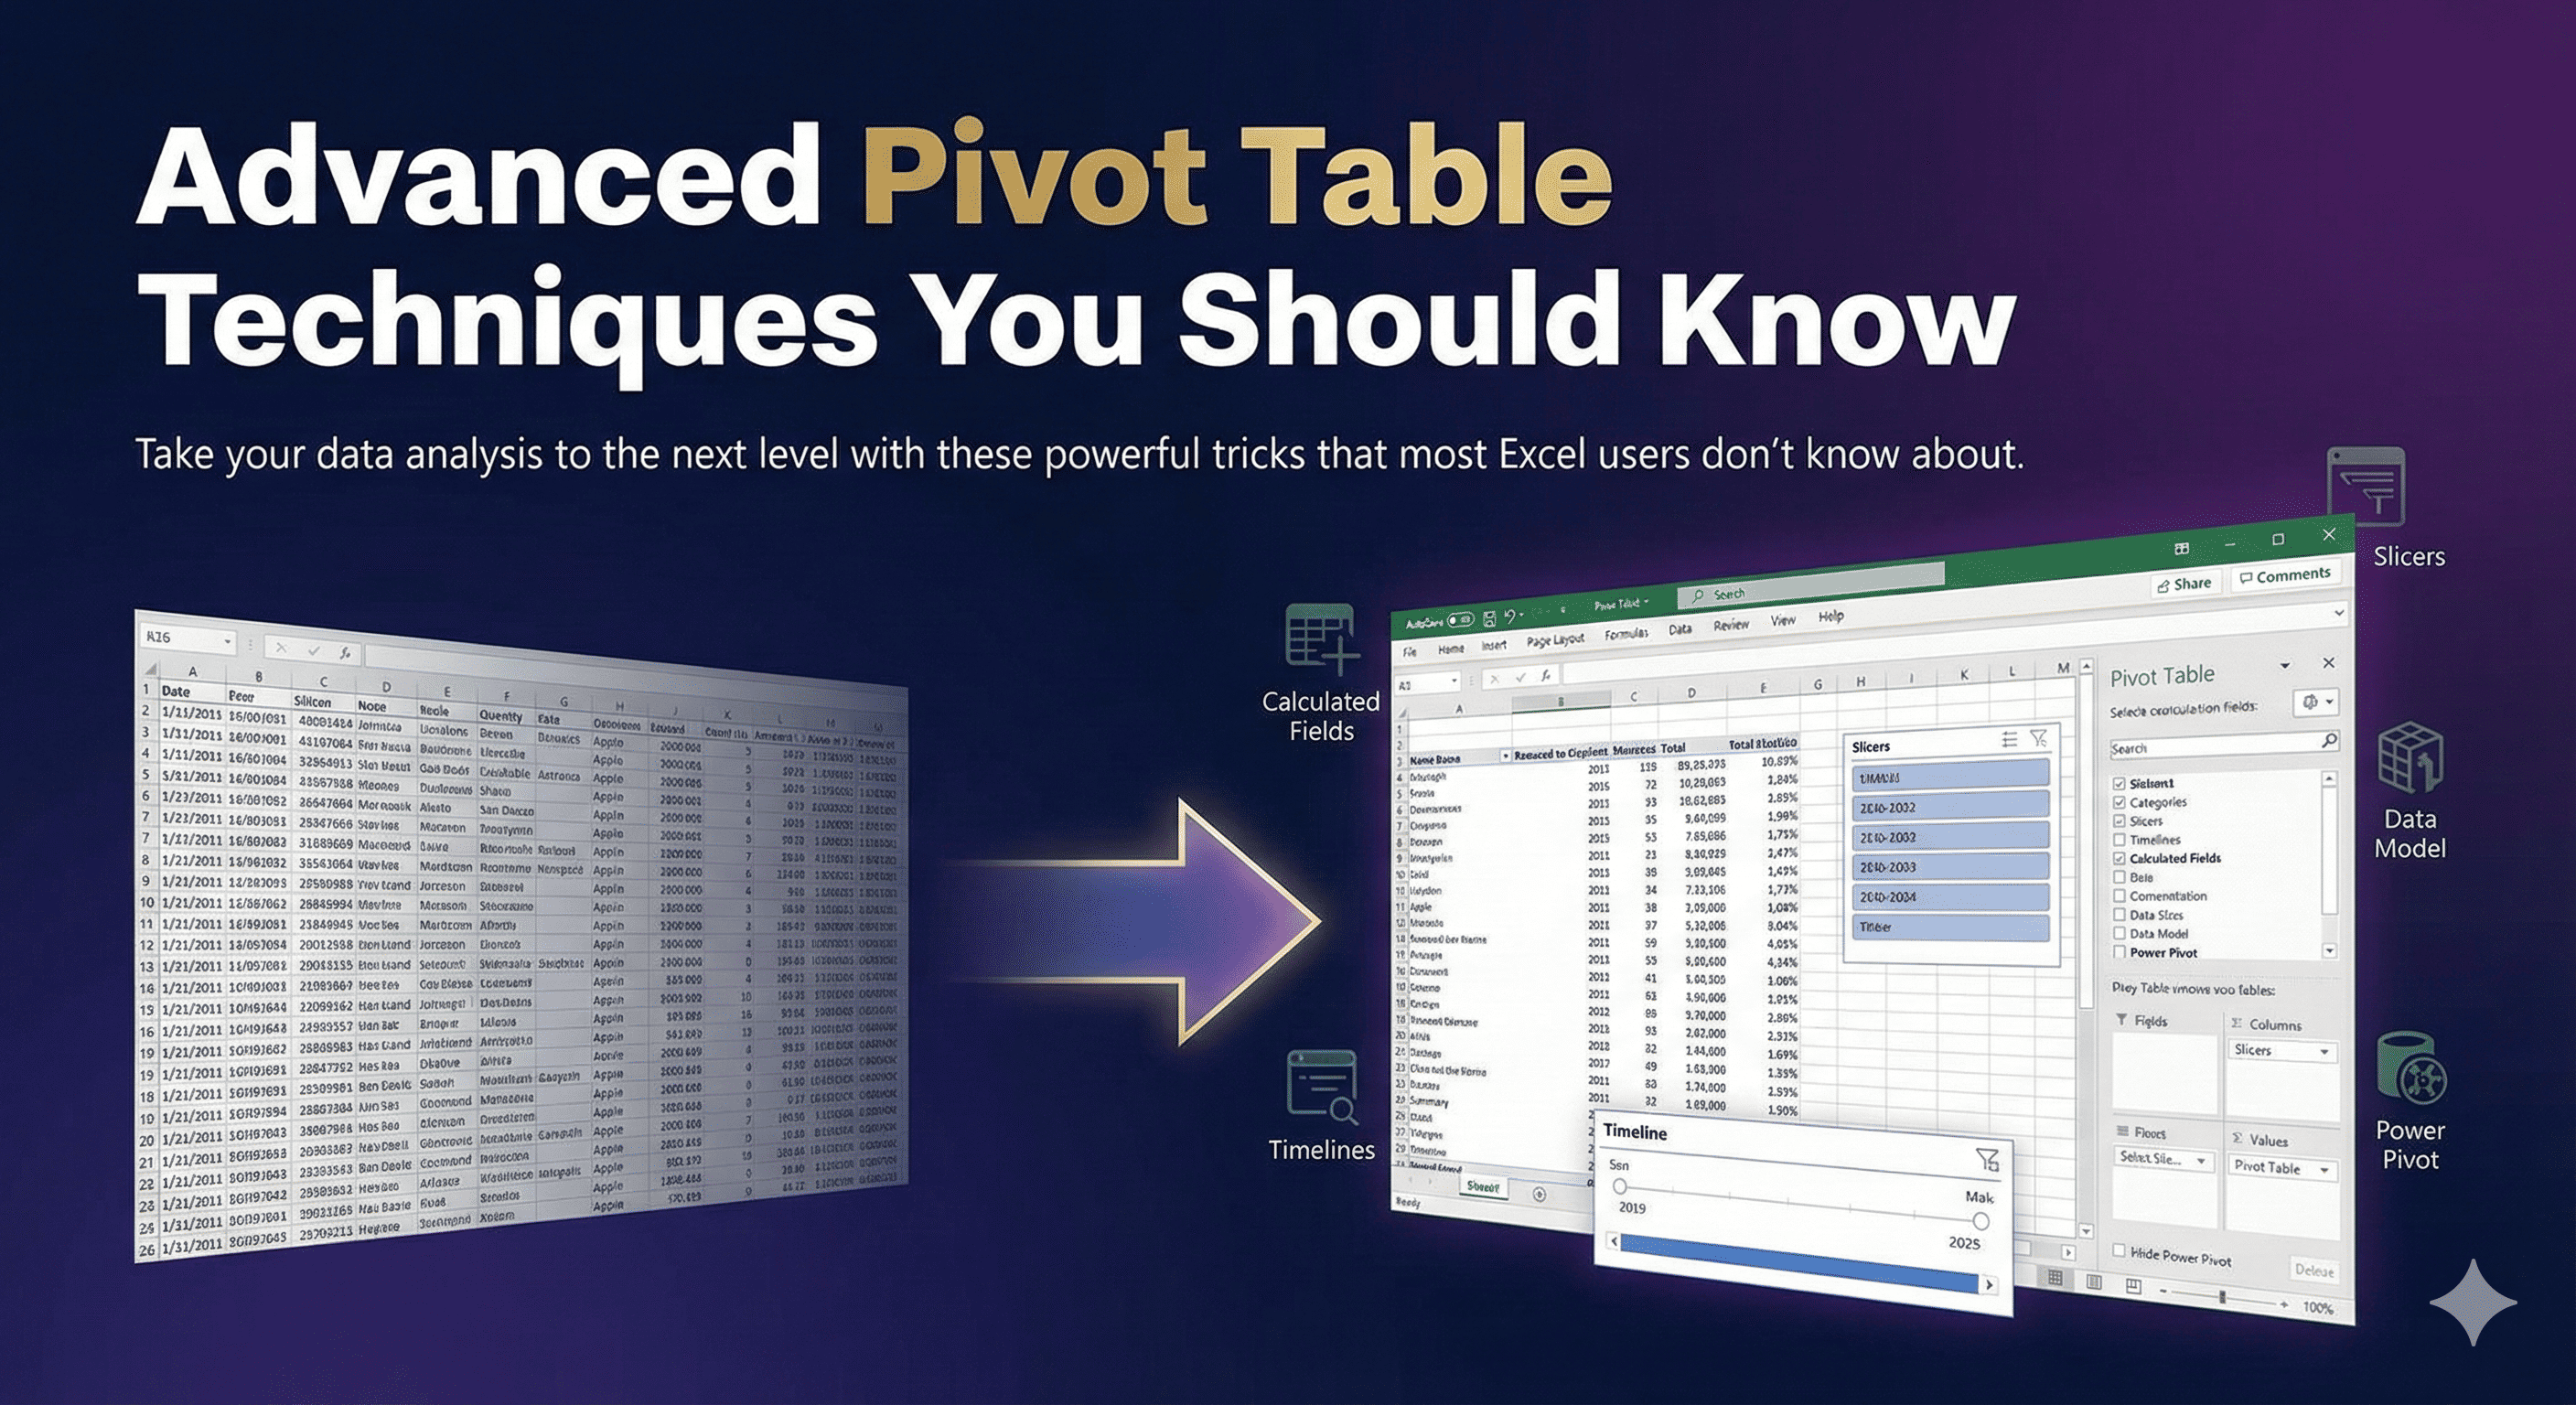
1. Calculated Fields
Create custom calculations within your pivot table without modifying your source data.
2. Grouping Dates
Group dates by month, quarter, or year for better trend analysis.
3. Show Values As
Display data as percentages, running totals, or ranked values.
4. Slicers for Interactive Filtering
Add visual filters that make exploring data intuitive and fast.
With these techniques, you'll transform raw data into actionable insights in minutes!